A student depression dataset was analysed using R.
Findings & Implications:
- Psychological Interventions ought to prioritise emotional coping for younger students since they are more likely to be depressed, whereas crisis support should be prioritised for older students since they are more likely to be suicidal.
- Academic pressure is the strongest predictor of depression, more than doubling the odds. Followed by financial stress, work/study hours, and cumulative grade-point average (CGPA).
- Study satisfaction works as a significant protective factor, helping to reduce the odds of depression amongst students.
- At the descriptive level (Mean and Standard Deviation), variables such as age, academic pressure, CGPA, study satisfaction, work/study hours, and financial stress barely change across subgroup dimensions like gender, city, degree, sleep duration, dietary habits, suicidal thoughts, and family mental-illness history. Academic and mental health patterns are thus more universal rather than driven based on subgroups.
- The only subgroup dimension that showed a meaningful difference was suicidal ideation at the descriptive level; e.g. such students face significantly higher academic pressure and lower study satisfaction. Hence, mental health interventions should target psychological variables first rather than demographic ones.
Visualisations & Explanations
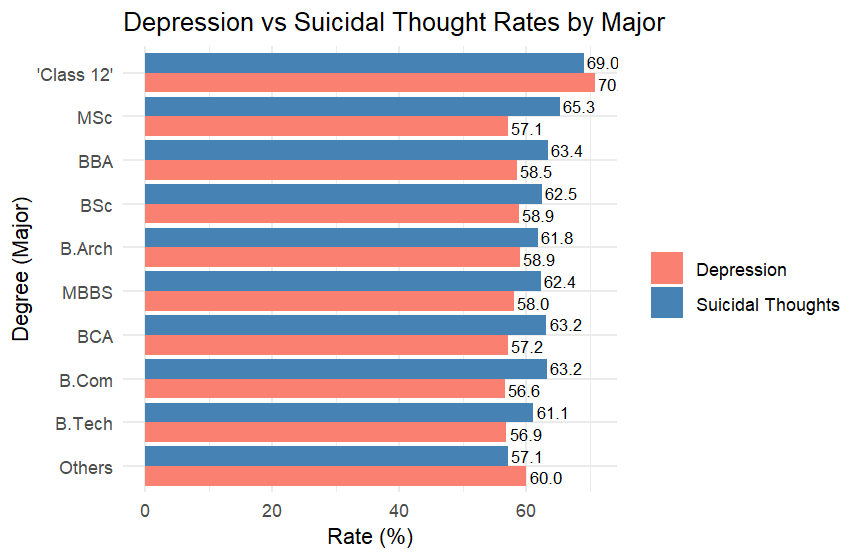
Figure 1: Younger students (Class 12) report higher depression rates (70%) but fewer suicidal thoughts (69%); whereas university students have lower depression rates (56.6%-58.9%) but more suicidal thoughts (61.1%-65.3%). Hence, psychological interventions should prioritise emotional coping for younger students since they are more depressed; and crisis support for older students since they are more suicidal.
Figure 1
Logistic Regression — Depression Odds & Predictors
Motivation
We sought to find which variable had the greatest impact on predicting depression. Knowing which variables are the biggest (and significant) predictors could help prioritise the right solutions and mental health approaches for students. As we aimed to predict a binary outcome (i.e. Depression is a binary variable), we thus used logistic regression.
Model results
Figure 2: Academic pressure (AP) was the strongest predictor of depression (β = 0.813, p < .05), more than doubling the odds per unit increase. Financial stress (FS) also raised depression risk (β = 0.573, p < .05), followed by Work/Study hours (W/S hours) (β = 0.117, p < .05). CGPA showed a small but significant positive effect (β = 0.0513, p < .05). However, study satisfaction (SS) significantly reduced depression likelihood (β = –0.225, p < .05). Overall, interventions ought to prioritise reducing AP due to its criticality, and SS should be promoted simultaneously as a protective factor.
Figure 2

More Findings
Using sapply() and is.numeric(), numerical variables with valid observations were kept, as seen from the Appendix (Table 1). ‘Job satisfaction’ and ‘Work Pressure’ contained only ‘0’ values, and were hence excluded. ‘Depression’ was not included due to it being a binary variable.
Using the group_by function, summaries for the dataset’s subgroups were found: ‘Gender’ (Table 2), ‘City’ (Table 3), ‘Degree’ (Table 4), ‘Sleep Duration’ (Table 5), ‘Dietary Habits’ (Table 6), ‘Have you ever had suicidal thoughts?’ (Table 7), and ‘Family History of Mental Illness’ (Table 8). Only the descriptive statistics (M and SD) were reported, as these are the core descriptive statistics for normally distributed data that measure central tendency and variability. For succinctness, only the four largest categories within each subgroup are shown in the tables, especially for variables like ‘City’ and ‘Degree’ that possess numerous categories.
Tables
Table 1
Dataset Summary
| Mean | Median | Standard Deviation | Maximum | Minimum | |
| Age | 25.82 | 25 | 4.91 | 59 | 18 |
| Academic Pressure | 3.14 | 3 | 1.38 | 5 | 0 |
| CGPA | 7.66 | 7.77 | 1.47 | 10 | 0 |
| Study Satisfaction | 2.94 | 3 | 1.36 | 5 | 0 |
| Work/Study Hours | 7.16 | 8 | 3.71 | 12 | 0 |
| Financial Stress | 3.14 | 3 | 1.44 | 5 | 1 |
Table 2
Gender Subgroup
| Gender | Age (M, SD) | Academic Pressure (M, SD) | CGPA (M, SD) | Study Satisfaction (M, SD) | Work/Study Hours (M, SD) | Financial Stress (M, SD) |
| Female | 25.77 (4.90) | 3.18 (1.38) | 7.60 (1.49) | 2.97 (1.37) | 7.10 (3.74) | 3.15 (1.44) |
| Male | 25.86 (4.91) | 3.11 (1.38) | 7.70 (1.46) | 2.92 (1.35) | 7.20 (3.68) | 3.13 (1.43) |
Table 3
City Subgroup
| City | Age (M, SD) | Academic Pressure (M, SD) | CGPA (M, SD) | Study Satisfaction (M, SD) | Work/Study Hours (M, SD) | Financial Stress (M, SD) |
| Delhi | 25.65 (4.92) | 3.42 (1.34) | 7.48 (1.48) | 3.05 (1.30) | 7.12 (3.74) | 3.20 (1.45) |
| Agra | 25.48 (4.85) | 2.98 (1.42) | 7.76 (1.45) | 2.95 (1.34) | 6.95 (3.74) | 3.06 (1.41) |
| Ahmedabad | 24.83 (5.04) | 3.25 (1.28) | 7.82 (1.47) | 2.99 (1.34) | 7.24 (3.69) | 3.25 (1.43) |
| Bangalore | 24.78 (5.12) | 3.19 (1.37) | 7.82 (1.39) | 2.94 (1.38) | 7.17 (3.64) | 3.17 (1.48) |
Table 4
Degree Subgroup
| Degree | Age (M, SD) | Academic Pressure (M, SD) | CGPA (M, SD) | Study Satisfaction (M, SD) | Work/Study Hours (M, SD) | Financial Stress (M, SD) |
| Class 12 | 20.13 (3.24) | 3.36 (1.30) | 7.59 (1.45) | 3.08 (1.38) | 7.28 (3.61) | 3.28 (1.41) |
| B.Arch | 25.64 (3.81) | 3.06 (1.41) | 7.62 (1.44) | 2.84 (1.35) | 7.27 (3.73) | 3.17 (1.45) |
| B.Com | 26.19 (3.92) | 3.08 (1.41) | 7.67 (1.47) | 2.94 (1.31) | 7.23 (3.65) | 3.12 (1.46) |
| B.Ed | 27.99 (3.90) | 3.12 (1.40) | 7.85 (1.49) | 2.90 (1.32) | 7.16 (3.71) | 3.08 (1.44) |
Table 5
Sleep Duration
| Sleep Duration | Age (M, SD) | Academic Pressure (M, SD) | CGPA (M, SD) | Study Satisfaction (M, SD) | Work/Study Hours (M, SD) | Financial Stress (M, SD) |
| 5–6 hours | 25.95 (4.93) | 3.12 (1.37) | 7.69 (1.45) | 2.95 (1.35) | 7.28 (3.73) | 3.11 (1.41) |
| 7–8 hours | 25.79 (4.90) | 3.14 (1.36) | 7.69 (1.48) | 2.94 (1.35) | 7.27 (3.70) | 3.17 (1.42) |
| <5 hours | 25.79 (4.86) | 3.23 (1.38) | 7.64 (1.46) | 2.92 (1.37) | 7.19 (3.68) | 3.15 (1.47) |
| >8 hours | 25.78 (4.95) | 3.05 (1.41) | 7.61 (1.49) | 2.98 (1.38) | 6.85 (3.71) | 3.11 (1.44) |
| Others | 27.33 (4.65) | 3.17 (0.92) | 7.60 (1.59) | 3.11 (1.49) | 6.78 (4.31) | 2.67 (1.46) |
Table 6
Dietary Habits Subgroup
| Dietary Habits | Age (M, SD) | Academic Pressure (M, SD) | CGPA (M, SD) | Study Satisfaction (M, SD) | Work/Study Hours (M, SD) | Financial Stress (M, SD) |
| Healthy | 26.1 (4.96) | 2.99 (1.38) | 7.65 (1.48) | 3.0 (1.36) | 7.02 (3.73) | 3.0 (1.43) |
| Moderate | 26.0 (4.94) | 3.09 (1.39) | 7.66 (1.48) | 2.92 (1.38) | 7.13 (3.71) | 3.08 (1.44) |
| Others | 26.4 (5.14) | 3.08 (1.68) | 7.53 (1.52) | 3.42 (1.44) | 4.58 (3.12) | 3.17 (1.59) |
| Unhealthy | 25.4 (4.81) | 3.30 (1.36) | 7.66 (1.45) | 2.93 (1.34) | 7.29 (3.69) | 3.31 (1.43) |
Table 7
Suicidal Thoughts Subgroup
| Suicidal Thoughts | Age (M, SD) | Academic Pressure (M, SD) | CGPA (M, SD) | Study Satisfaction (M, SD) | Work/Study Hours (M, SD) | Financial Stress (M, SD) |
| No | 26.6 (4.99) | 2.67 (1.38) | 7.64 (1.49) | 3.09 (1.36) | 6.57 (3.84) | 2.75 (1.42) |
| Yes | 25.4 (4.80) | 3.42 (1.31) | 7.67 (1.46) | 2.86 (1.36) | 7.50 (3.59) | 3.37 (1.40) |
Table 8
Family History of Mental Illness Subgroup
| Family History of Mental Illness | Age (M, SD) | Academic Pressure (M, SD) | CGPA (M, SD) | Study Satisfaction (M, SD) | Work/Study Hours (M, SD) | Financial Stress (M, SD) |
| No | 25.8 (4.88) | 3.10 (1.39) | 7.66 (1.47) | 2.95 (1.36) | 7.09 (3.73) | 3 (1.43) |
| Yes | 25.8 (4.94) | 3.18 (1.37) | 7.65 (1.47) | 2.94 (1.38) | 7.22 (3.69) | 3 (1.44) |
The complete project can be found below alongside the dataset and code.
Final Project Document
Dataset
https://www.kaggle.com/datasets/adilshamim8/student-depression-dataset